South Florida Real Estate Market Update: August 2026
Broward and Miami-Dade home prices, closed sales, inventory and market time—broken down by single-family homes and townhouses/condos.
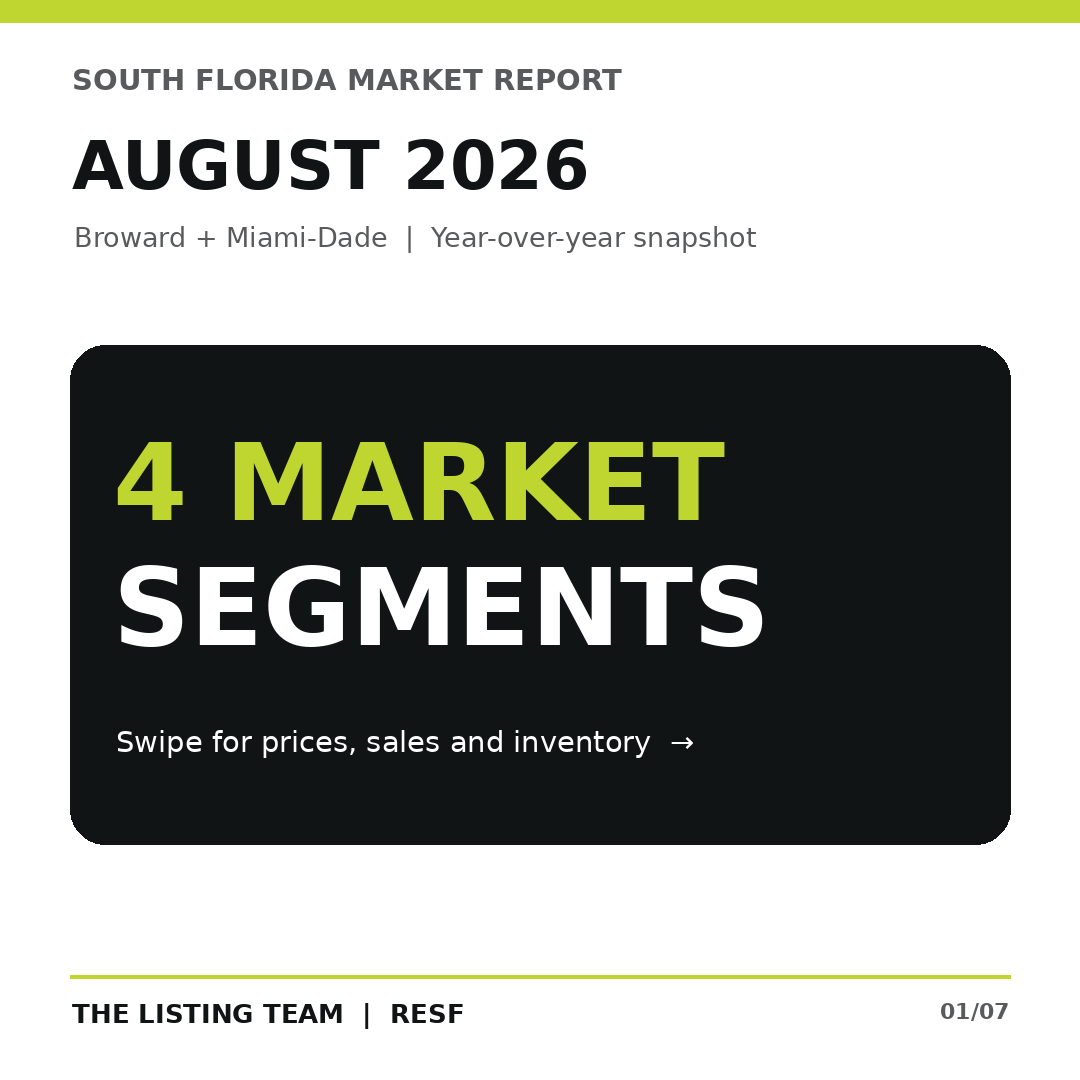
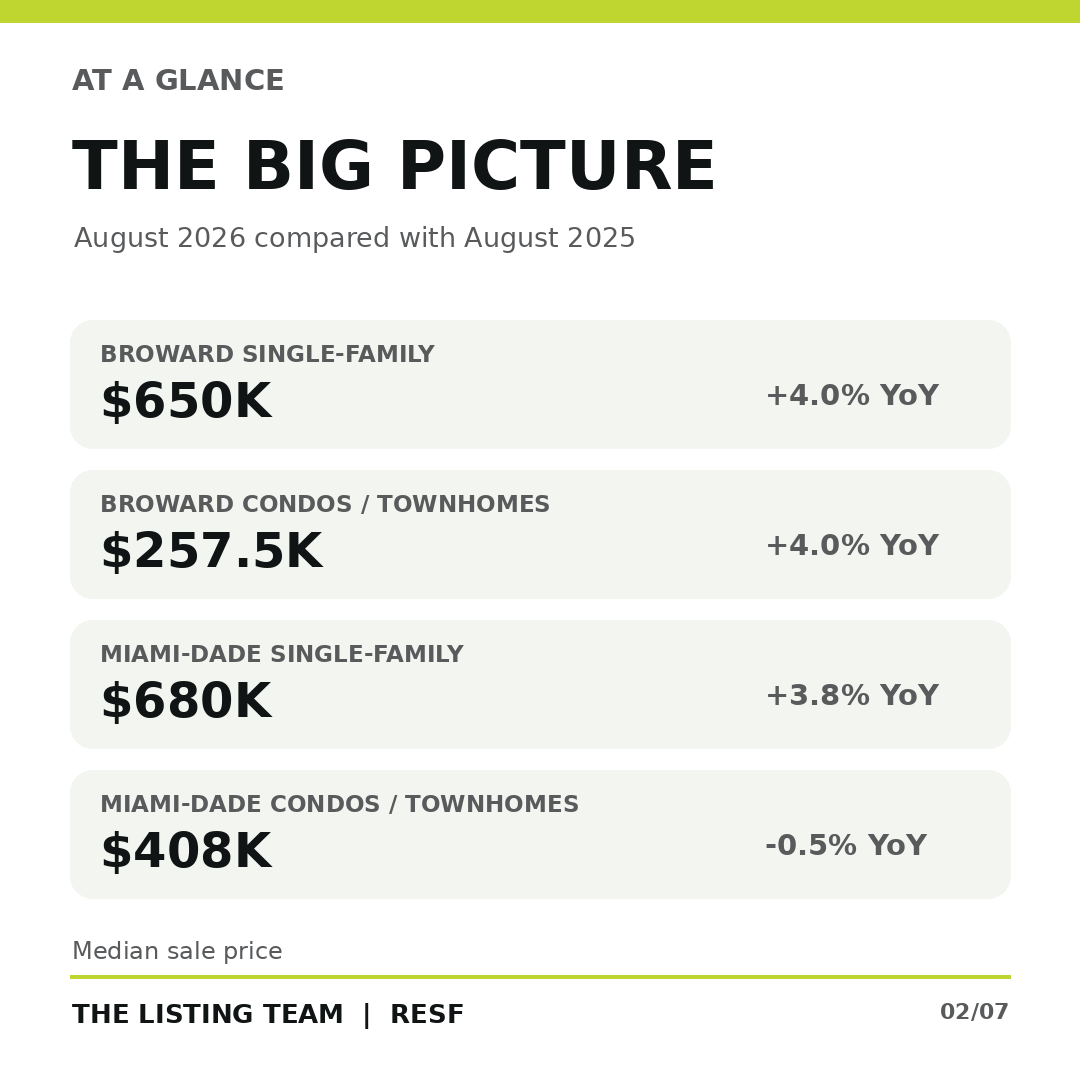
August brought a mixed picture to South Florida. Median single-family sale prices rose year over year in both counties, while closed sales were nearly flat in Broward and declined in Miami-Dade. The townhouse and condo markets also diverged: Broward's median price rose, while Miami-Dade's edged lower. In all four segments, active inventory was lower than a year earlier.
August 2026 South Florida housing market at a glance
The two counties and two property types show different levels of supply and selling time. This table reports August 2026 figures with year-over-year changes in parentheses.
| County and property type | Closed sales | Median sale price | Median time to contract | Active listings | Months of supply |
|---|---|---|---|---|---|
| Broward single-family | 1,016 (+0.1%) | $650,000 (+4.0%) | 40 days (-14.9%) | 4,252 (-22.5%) | 4.1 (-28.1%) |
| Broward townhouses and condos | 883 (-9.3%) | $257,500 (+4.0%) | 73 days (-1.4%) | 9,427 (-14.8%) | 9.9 (-16.8%) |
| Miami-Dade single-family | 858 (-3.1%) | $680,000 (+3.8%) | 40 days (-21.6%) | 4,330 (-19.2%) | 4.9 (-23.4%) |
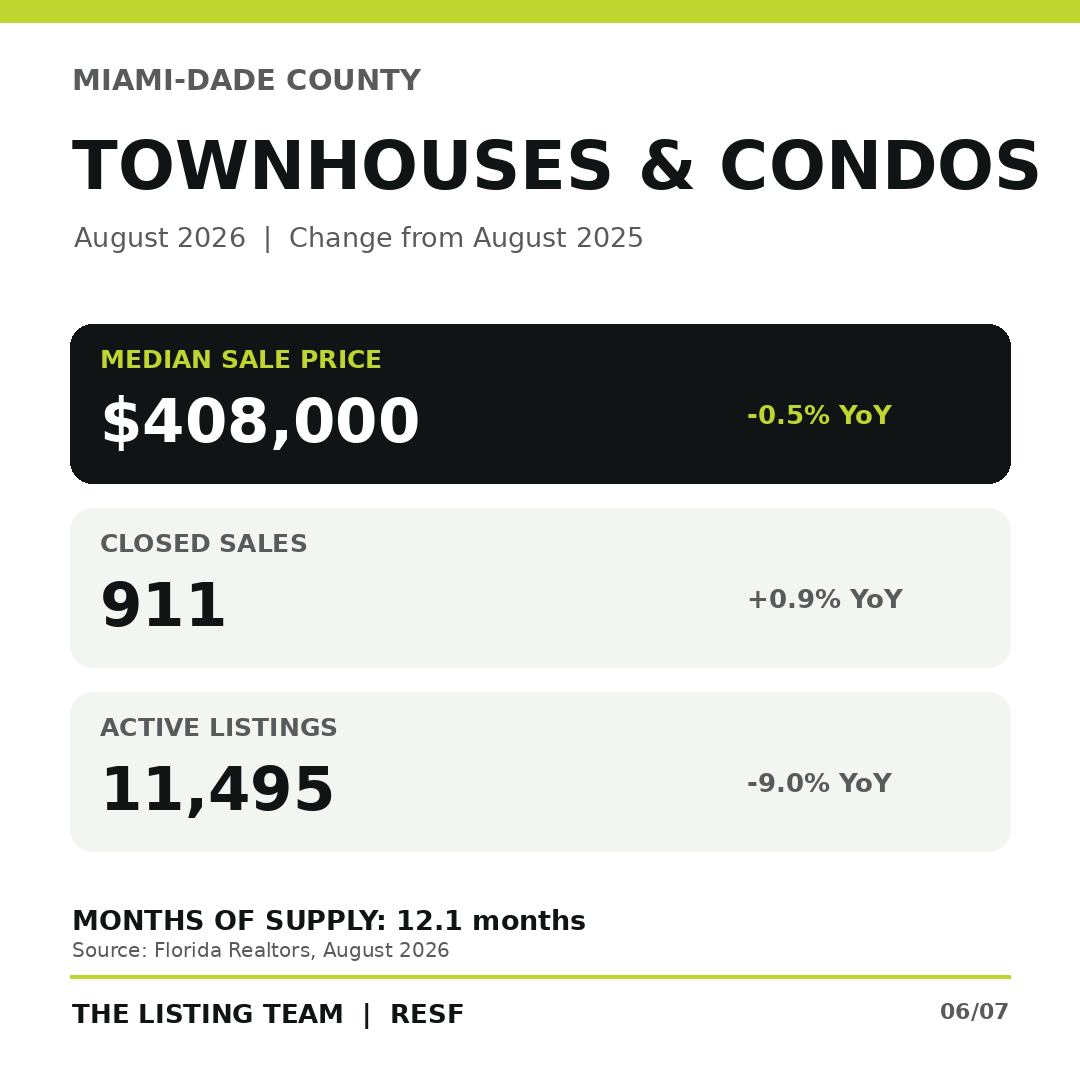
| Miami-Dade townhouses and condos | 911 (+0.9%) | $408,000 (-0.5%) | 66 days (-1.5%) | 11,495 (-9.0%) | 12.1 (-13.6%) |
“Median time to contract” measures the time until a contract; “median time to sale” includes the additional period through closing. Months of supply is a market-wide inventory measure, not a prediction of how long an individual listing will take to sell.
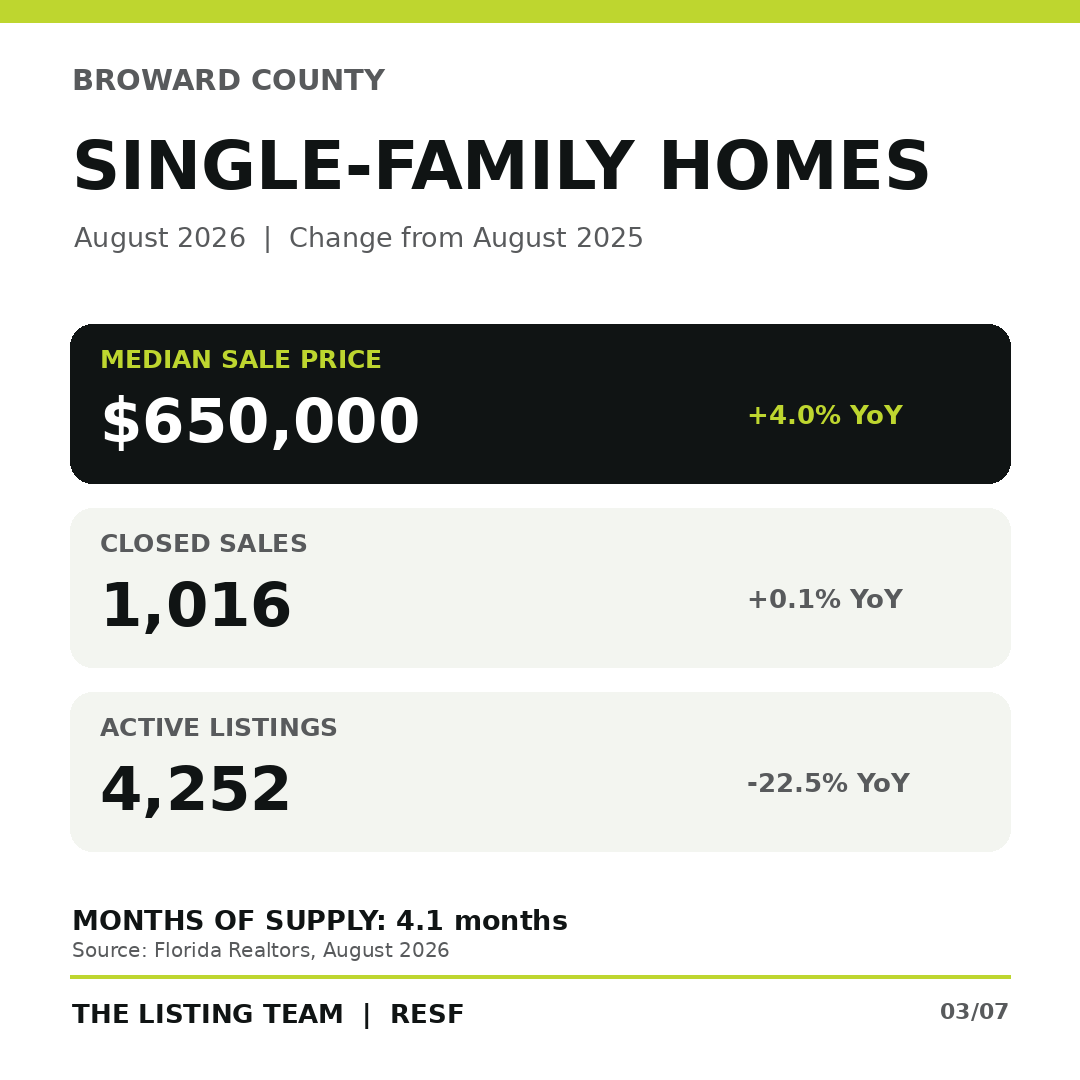
Broward County single-family homes: prices up, inventory down
Broward recorded 1,016 single-family closings, almost unchanged from 1,015 a year earlier (+0.1%). The median sale price rose from $625,000 to $650,000 (+4.0%). Average sale price reached $909,069 (+7.3%), and total dollar volume rose to $923.6 million (+7.4%).
Homes reached a contract in a median 40 days, down from 47 days. Median time to sale was 78 days, versus 83. Active listings fell to 4,252 (-22.5%), and months of supply declined from 5.7 to 4.1. New pending sales fell 5.4% to 1,115, a reminder that a higher median price does not mean every demand measure increased.
For a homeowner in Fort Lauderdale or elsewhere in Broward, these countywide numbers are context. Comparable homes in the same neighborhood, condition and price range are more useful for a listing decision.
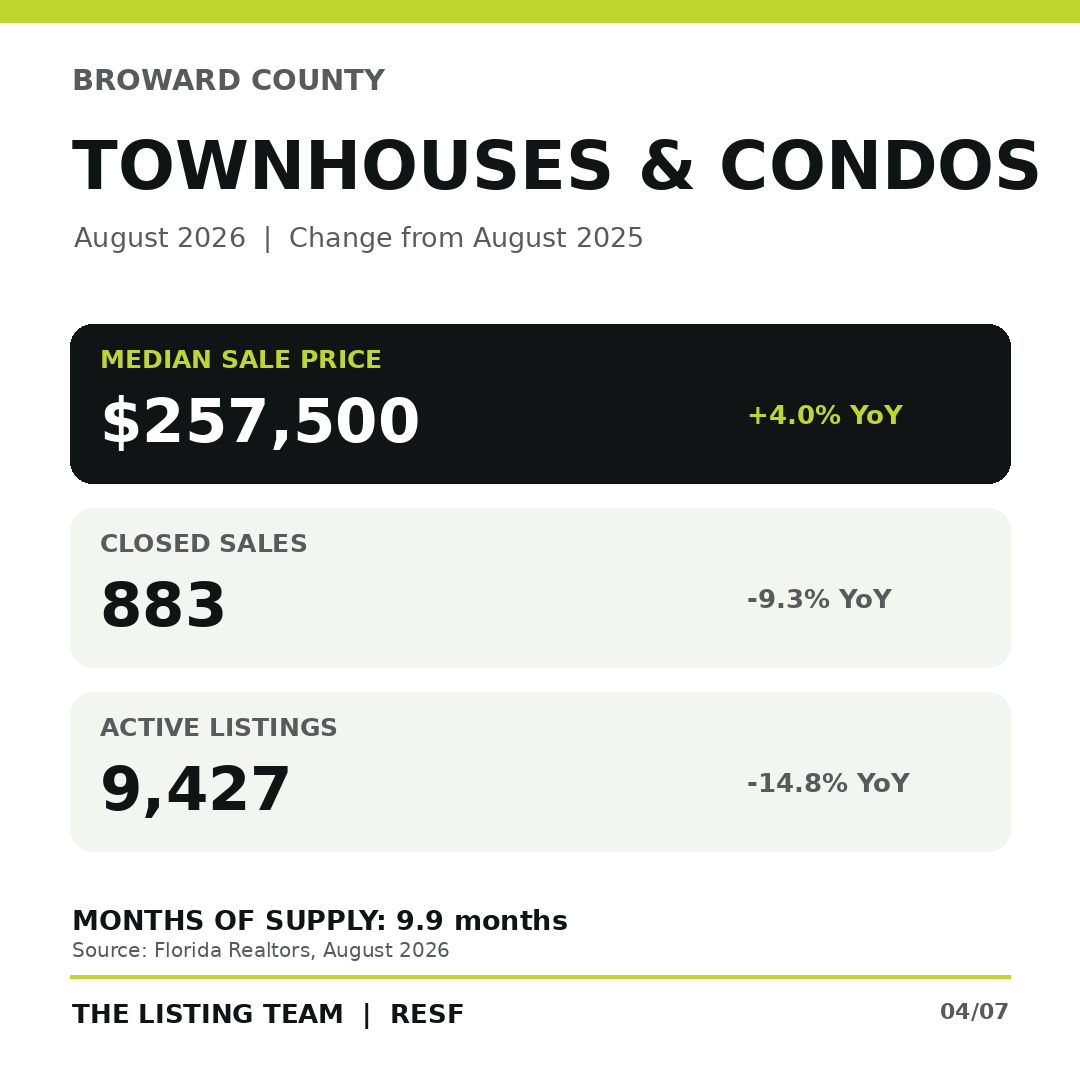
Broward townhouses and condos: higher median price, fewer closings
Townhouse and condo closed sales fell from 974 to 883 (-9.3%). Yet the median sale price climbed from $247,700 to $257,500 (+4.0%). These are different measures: fewer transactions can coincide with a higher median when the mix of properties sold changes.
Median time to contract was 73 days, compared with 74 in August 2025, while median time to sale was 112 days. Active inventory decreased to 9,427 (-14.8%). Even after that decline, the segment carried 9.9 months of supply, well above the county's 4.1 months for single-family homes. New pending sales declined 8.3% to 1,000.
Condo sellers should examine recent building-level sales, association costs and competing units when setting an asking price. Buyers should review association documents, insurance, reserves, assessments and building condition before committing to a purchase.
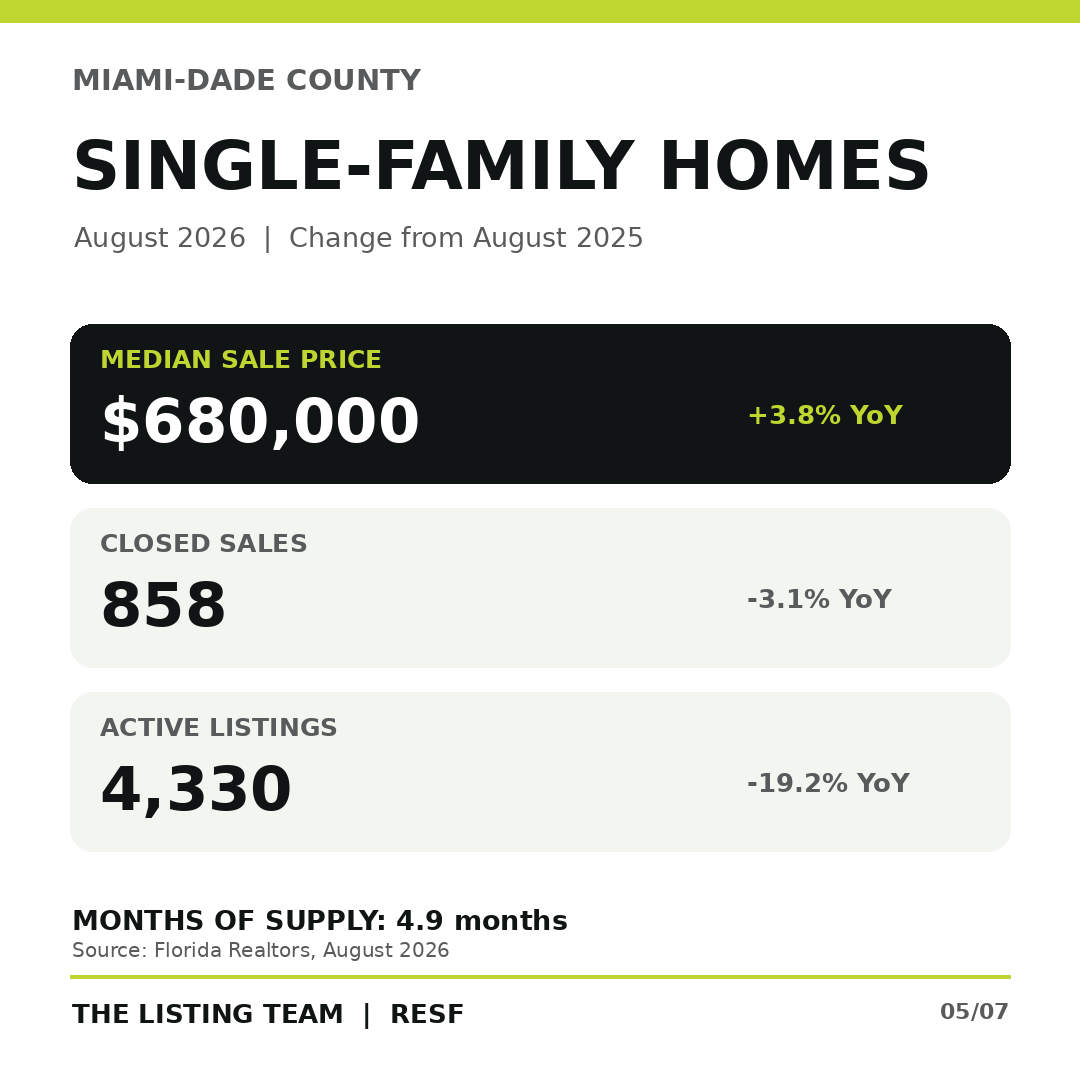
Miami-Dade single-family homes: faster contracts, fewer sales
Miami-Dade had 858 single-family closed sales, down 3.1% from 885. The median sale price rose from $655,000 to $680,000 (+3.8%). Median time to contract shortened from 51 days to 40 days (-21.6%), and median time to sale declined from 91 to 80 days.
Active listings totaled 4,330 (-19.2%), with 4.9 months of supply, down from 6.4. New listings increased 3.6% to 1,365, while new pending sales were essentially flat at 964 (-0.2%). Faster contract times and tighter inventory do not erase the decline in closed transactions; the measures describe different stages of market activity.
Miami-Dade townhouses and condos: sales up slightly, price down slightly
Closed sales increased from 903 to 911 (+0.9%). The median sale price moved from $410,000 to $408,000 (-0.5%), and the average sale price declined 2.4% to $726,211. Median time to contract was 66 days, one day shorter than a year earlier; median time to sale was 108 days, two days longer.
There were 11,495 active listings (-9.0%) and 12.1 months of supply, compared with 14.0 months a year earlier. New pending sales rose 4.0% to 1,032 and new listings rose 4.8% to 2,054. This segment had the most months of supply among the four covered here, despite the year-over-year reduction.
What the August report means for South Florida buyers and sellers
For buyers
- Compare supply within your property type. August townhouse and condo supply was 9.9 months in Broward and 12.1 in Miami-Dade, versus 4.1 and 4.9 for single-family homes.
- Check the property, building, association and total ownership costs. County medians cannot tell you whether a particular home is priced fairly.
- Use recent comparable sales and current competition before making an offer.
For sellers
- Price against current competitors and recent closed sales in your local segment.
- Plan for the contract period as well as the closing period: August median times to contract ranged from 40 to 73 days across the four segments.
- Prepare condition and association information early so buyers can evaluate the property.
Read the July 2026 South Florida market update for the prior monthly snapshot. Its month-to-month differences should be read separately from the year-over-year changes in this report.
Frequently asked questions
What was Broward's median single-family sale price in August 2026?
$650,000, up 4.0% from August 2025. There were 1,016 closed single-family sales.
What was Miami-Dade's median single-family sale price?
$680,000, up 3.8% from August 2025. There were 858 closed single-family sales.
How much condo and townhouse supply was available?
Broward had 9.9 months of supply and Miami-Dade had 12.1 months of supply in August 2026. Both were lower than in August 2025.
Did active inventory rise or fall?
Active inventory fell year over year in all four segments: Broward single-family (-22.5%), Broward townhouses and condos (-14.8%), Miami-Dade single-family (-19.2%), and Miami-Dade townhouses and condos (-9.0%).
Do these county figures tell me what my home is worth?
No. A property-specific estimate needs recent comparable sales, location, condition, features, current listings and other relevant factors.
Get a local market analysis for your property
County trends help frame the conversation. The right next step is to compare your home or target neighborhood with current inventory and recent sales.

Source and method: Florida Realtors® Monthly Market Detail, August 2026, using data provided by Florida's multiple listing services; released September 16, 2026. Figures are reproduced from the supplied The Home Owners Listing Team August 2026 report for Broward and Miami-Dade. Percentage changes compare August 2026 with August 2025, not July 2026. Source figures may be revised. This article offers general market information, not an appraisal or a prediction of any property's sale price.